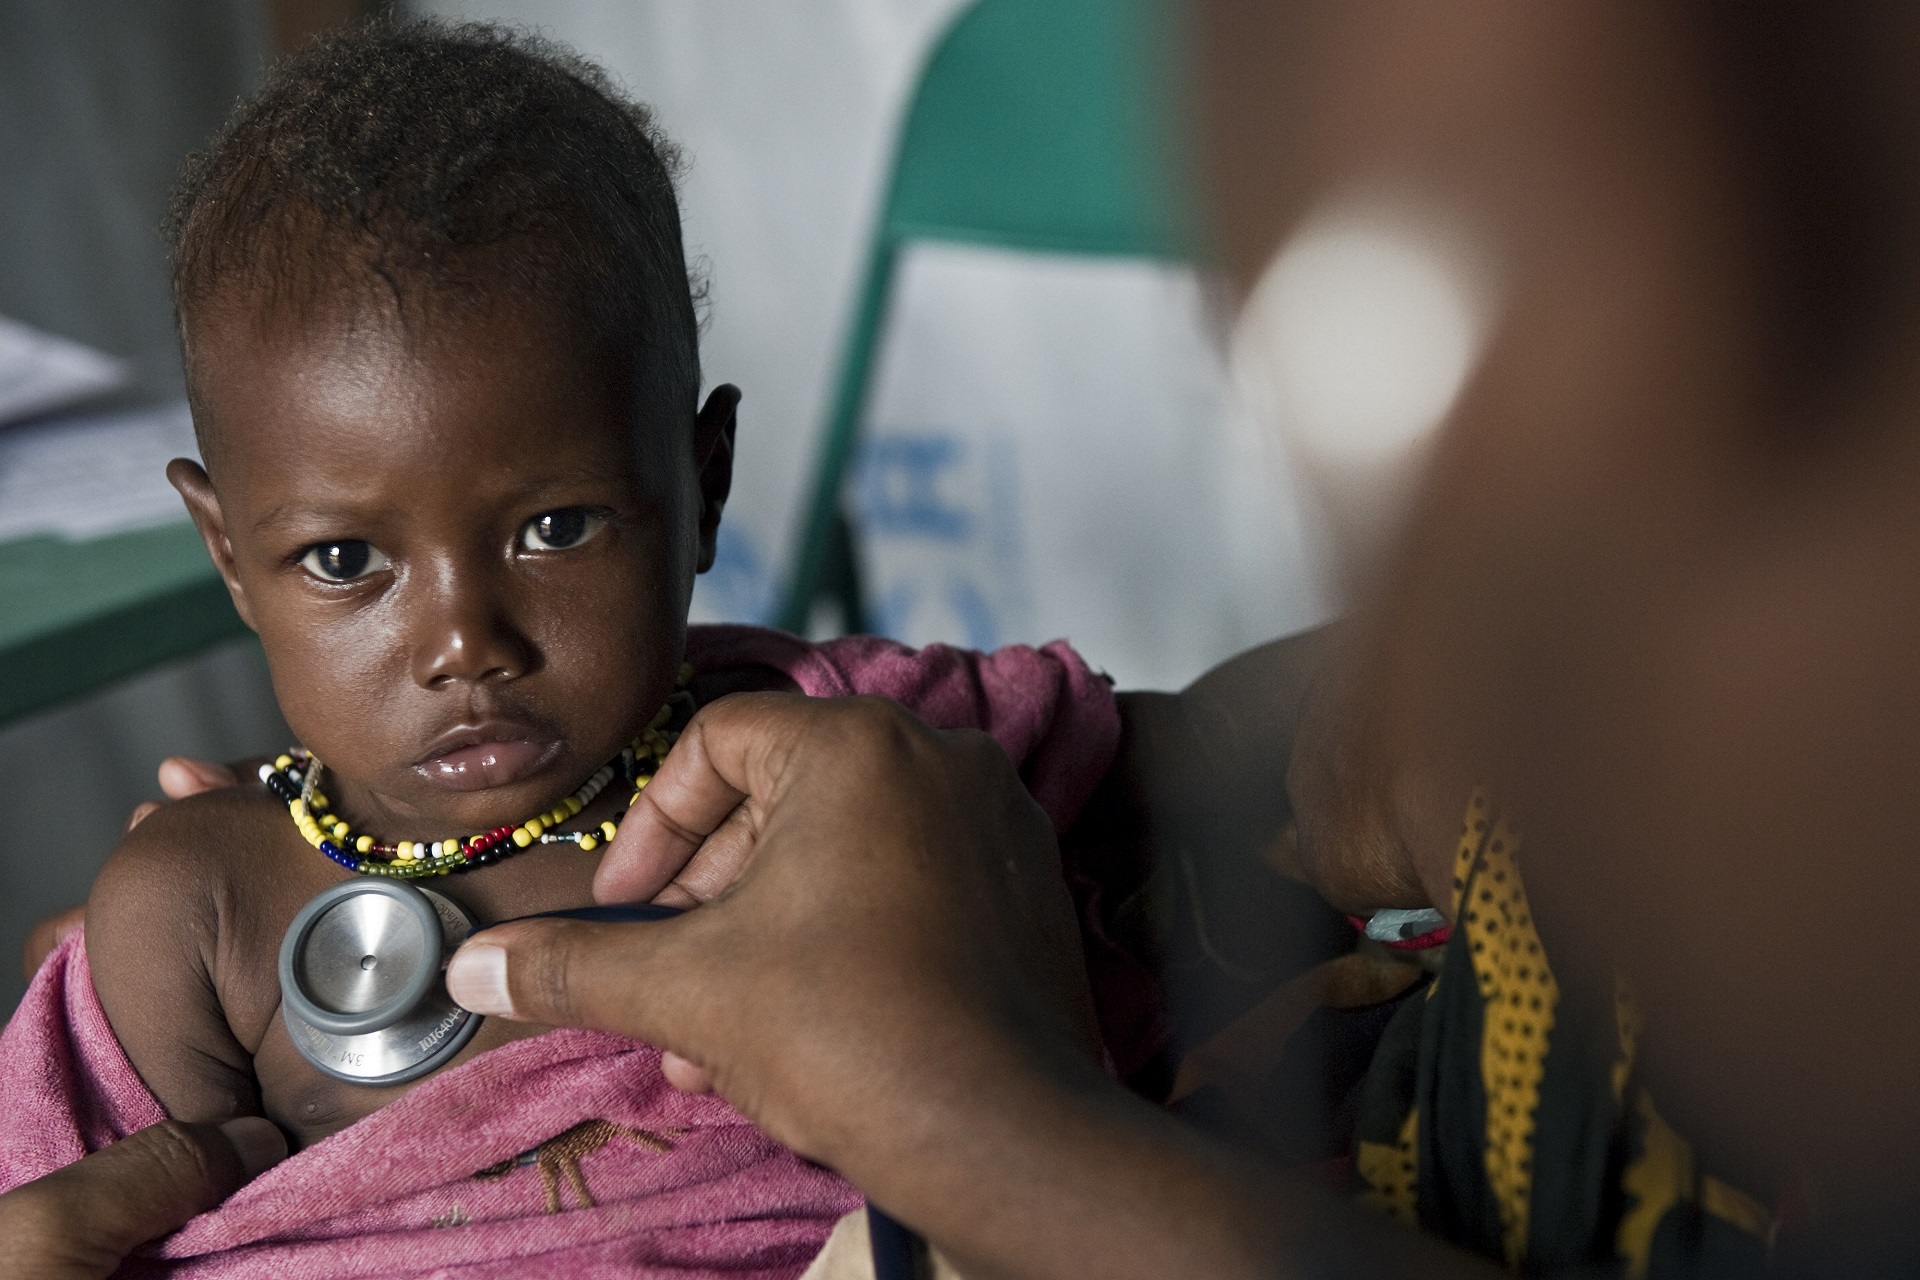
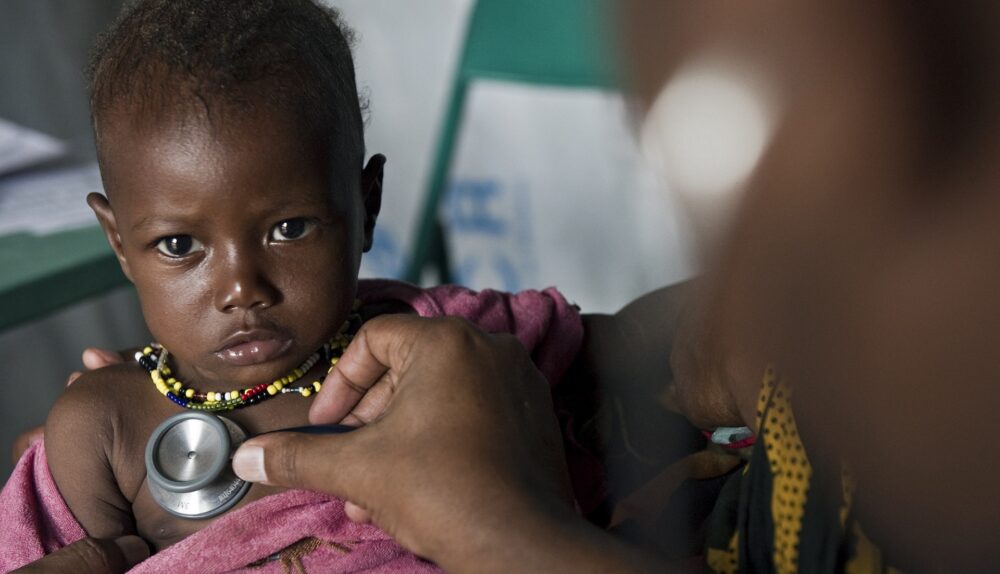
Neighborhood Summary

Download all neighborhood facts   |   Compare this neighborhood

Westwood

View map of Denver

P.T. Barnum of "The Barnum & Bailey Circus" bought 760 acres of undeveloped land just west of Denver and platted a subdivision in 1882. He paid $11,000 for the land. From this project, some years later, another ... more


Most Recent Data

Indicator 2000 Data Most Recent Data Data Year
Total Population 14,999 15,486 2010
Denver Public School Enrollment (Grades 1 - 12) 2,695 4,056 2011
Total Births * 416 363 2010
% Births Non-Latino White * 11.54% 11.02% 2010
% Births African-American * 1.2% 1.93% 2010
% Births Latino * 82.69% 78.24% 2010
% Birth Native American * 2.64% 1.1% 2010
% Birth Asian/Pacific Islander * 1.92% 2.48% 2010
% Births Other Race * 0% 1.2% 2008
Total Foreclosure Filings 43 246 2009

Schools that serve Westwood

Elementary Schools

Middle Schools

High Schools


Additional notes

none


Westwood Community Facts Data


Note: Clicking on will open a new window with a geographical comparison of that indicator for all neighborhoods in Denver.

Download this data

Population and Households

General

Indicator Westwood Denver Data Year Map
Total Population 15,486 600,158 2010
Households 4,340 263,107 2010
Denver Public School Enrollment (Grades 1 - 12) 4,056 77,366 2011
Total Births * 363 "9,565" 2010

Show General data definitions

Race/Ethnicity

Indicator Westwood Denver Data Year Map
% Population Non-Latino White 11.39% 52.15% 2010
% Population African American 1.65% 9.73% 2010
% Population Latino 80.67% 31.82% 2010
% Population Native American 0.96% 0.59% 2010
% Population Asian/Pacific Islander 4.35% 3.32% 2010
% Population Other Race (Single Race Selected) 0.26% 0.2% 2010
% Population of 2 or More Races 0.7% 2.11% 2010
% Foreign Born 34.92% 17.42% 2000
% Adults Non-English Speaking 25.1% 9.2% 2000
% Births Non-Latino White * 11.02% 43.13% 2010
% Births African-American * 1.93% 10.93% 2010
% Births Latino * 78.24% 38.31% 2010
% Birth Native American * 1.1% 0.91% 2010
% Birth Asian/Pacific Islander * 2.48% 3.82% 2010
% Births Other Race * 1.2% 1.96% 2008
% Births to Foreign Mothers * 56.97% 34.16% 2008

Show Race/Ethnicity data definitions

Age

Indicator Westwood Denver Data Year Map
% Population under 6 13.53% 8.59% 2010
% Population 6-11 12.77% 7.05% 2010
% Population 12-17 10.36% 5.81% 2010
% Population 18-24 10.67% 10.41% 2010
% Population 25-34 15.4% 20.47% 2010
% Population 35-44 14.22% 14.96% 2010
% Population 45-54 9.68% 12.08% 2010
% Population 55-64 6.53% 10.29% 2010
% Population over 65 6.84% 10.35% 2010

Show Age data definitions

Families and Households

Indicator Westwood Denver Data Year Map
Persons per Household 3.5622 2.2203 2010
% 1-Person Households 17.88% 40.6% 2010
% Families with Children 54.45% 24.8% 2010
% Families without Children 21.73% 22.71% 2010
% Non-Family Households 5.94% 11.89% 2010
% Children Living with Single Parents 26.93% 28.01% 2000
% Births to Teen Mothers (19 and under) * 19.01% 9.09% 2010
% Births to Unwed Mothers * 31.68% 25.32% 2010

Show Families and Households data definitions

Mobility

Indicator Westwood Denver Data Year Map
% Persons Age 5+ Living in Denver Who Lived in a City Other than Denver in 1995 24% 33.01% 2000
% Households Living at Current Address Less than 1 Year 23.53% 28.68% 2000

Show Mobility data definitions


Download this data

Youth

Student Demographics

Indicator Westwood Denver Data Year Map
% DPS Non-Latino White Students 5.14% 22.22% 2009
% DPS African-American Students 2.57% 16.85% 2009
% DPS Latino Students 87.83% 56.08% 2009
% DPS Other Race Students 4.46% 4.84% 2009
% DPS Children Receiving Free School lunch 95.09% 73.04% 2011

Show Student Demographics data definitions

Newborns

Indicator Westwood Denver Data Year Map
Premature Birth Rate * 8.17 9.86 2008
Low Birth Weight Rate * 10.1 9.58 2008
% Births to Women Receiving Late or No Prenatal Care * 11.78% 8.63% 2008

Show Newborns data definitions

Early Education

Indicator Westwood Denver Data Year Map
% Children under 12 in Subsidized Child Care 6.94% 6.87% 2003
# Licensed Child Care Slots 397 23,886 2003

Show Early Education data definitions


Download this data

Economic Well Being

Poverty and Income

Indicator Westwood Denver Data Year Map
Average Household Income $37,961 $55,129 2000
% Children (under 18) on TANF 5.4% 4.57% 2002
% Children (under 18) on Medicaid 33.77% 22.49% 2002
% Persons in poverty 24.05% 14.29% 2000
% Children (under 18) in Poverty 31.54% 20.82% 2000
% Families in Poverty 23.51% 10.63% 2000
% Single Mothers with Children in Poverty 51.1% 32.58% 2000
% Households with Income less than 100% of Denver's Median Income 64.36% 49.9% 2000
% Households with Income 100 to 200% of Denver's Median Income 28.66% 30.9% 2000
% Households with Income Greater than 200% of Denver's Median Income 6.98% 19.19% 2000
% Non-Latino Whites in Poverty 19.37% 7.8% 2000
% African-Americans in Poverty 20.8% 19.37% 2000
% Latinos in Poverty 25.37% 22.47% 2000
% Native Americans in Poverty 52.6% 27.3% 2000
% Asian and Pacific Islanders in Poverty 13.74% 16.83% 2000

Show Poverty and Income data definitions

Labor and Employment

Indicator Westwood Denver Data Year Map
Total jobs 2,975 486,669 2002
% Government Jobs 0.81% 5.41% 2002
% Service Jobs 27.06% 36.06% 2002
% Transportation, Communications & Public Utility Jobs 0.5% 9.09% 2002
% Finance, Insurance & Real Estate Jobs 0.81% 7.12% 2002
% Manufacturing jobs 0.2% 5.93% 2002
% Retail Trade Jobs 9.88% 12.52% 2002
% Construction Jobs 3.6% 4.26% 2002
% Wholesale Trade Jobs 0.94% 5.37% 2002
% Mining jobs 0% 0.85% 2002
% Other jobs 56.2% 13.39% 2002
Average Annual Wage $11,336 $37,407 2000
Unemployed as % of Civilian Labor Force 7.61% 5.67% 2000

Show Labor and Employment data definitions

Adult Education

Indicator Westwood Denver Data Year Map
% Persons age 25+ with less than 12th grade education 55.9% 21.11% 2000
% Persons age 25+ with high school only education 25.51% 20.01% 2000
% Persons age 25+ with some college but no degree 11.81% 19.52% 2000
% Persons Age 25+ with college degree (Associates or Better) 6.77% 39.37% 2000
% Births to women with less than 12th grade education * 5.53% 24.08% 2008

Show Adult Education data definitions


Download this data

Housing

Homeownership

Indicator Westwood Denver Data Year Map
# Housing Units 4,717 70,549 2010
% Housing Owner-Occupied 55.27% 52.48% 2000
% non-Latino White Homeowners 65.22% 62.62% 2000
% African-American Homeowners 28.11% 48.37% 2000
% Latino Homeowners 54.29% 49.11% 2000
% Native American Homeowners 44.36% 42% 2000
% Asian/Pacific Islander Homeowners 29.81% 44.87% 2000
Median Income for Home Purchasers $44,690 $65,400 2003
Average Loan Amount for Home Purchasers $158,983 $203,763 2003
% Approved Loan Applications - White 58% 65.23% 2003
% Approved Loan Applications - Non-White 52.96% 54.78% 2003
% Sub-prime Loans - Total 16.49% 11.88% 2003
% Sub-prime Loans - White 34.78% 9.24% 2003
% Sub-prime Loans - African American 0% 18.92% 2002
% Sub-prime Loans - Latino 12.82% 16.09% 2003
Total Foreclosure Filings 246 6,101 2009

Show Homeownership data definitions

Housing Characteristics

Indicator Westwood Denver Data Year Map
Average Home Sale Price $160,267 $278,024 2003
% Housing Vacancy 7.99% 9.15% 2010
% Housing Publicly Subsidized 10.2% 6.6% 1999
% Renters paying more than 30% of income on Housing 45.07% 38.6% 2000
% of Overcrowded Housing Units 24.3% 7.71% 2000
% Housing Units Built Before 1940 11.82% 24.5% 2000

Show Housing Characteristics data definitions


Download this data

Crime And Safety

Crime

Indicator Westwood Denver Data Year Map
% Property Crimes 44.23% 57.74% 2007
% Violent Crimes 13.97% 8.27% 2007
% Other Crimes 41.8% 33.99% 2007
Crime Rate per 1,000 Persons 59.28 68.62 2007
Burglary Crime Rate per 1,000 Households 29.4 22.48 2007
Violent crime rate per 1,000 Persons 8.28 5.68 2007

Show Crime data definitions

Child Abuse

Indicator Westwood Denver Data Year Map
Confirmed Child Abuse & Neglect Rate 5.4 7.48 2004
3-Year Cumulative Confirmed Child Physical Abuse Rate 5.04 5.19 2004
3-Year Cumulative Confirmed Child Neglect Rate 10.43 11.56 2004
Out-of-Home Placement Rate 0 11.48 2004

Show Child Abuse data definitions


* Please see the data definition for indicators marked with an asterisk for specific information on the calculation or display of the data for these indicators.